Kể từ bây giờ chúng tôi là Elev8
Chúng tôi không chỉ là một nhà môi giới. Chúng tôi là một hệ sinh thái giao dịch tất cả trong một—mọi thứ bạn cần để phân tích, giao dịch và phát triển đều có ở một nơi. Sẵn sàng nâng tầm giao dịch của bạn?
Chúng tôi không chỉ là một nhà môi giới. Chúng tôi là một hệ sinh thái giao dịch tất cả trong một—mọi thứ bạn cần để phân tích, giao dịch và phát triển đều có ở một nơi. Sẵn sàng nâng tầm giao dịch của bạn?
EUR/USD bleeds lower after piercing through a long-term trend line. The 50 and 100-day Simple Moving Averages (SMA) also lie broken in its wake. Nothing can stop bears now, or so it seems. The trend is down, and given “the trend is your friend” the odds favor more.
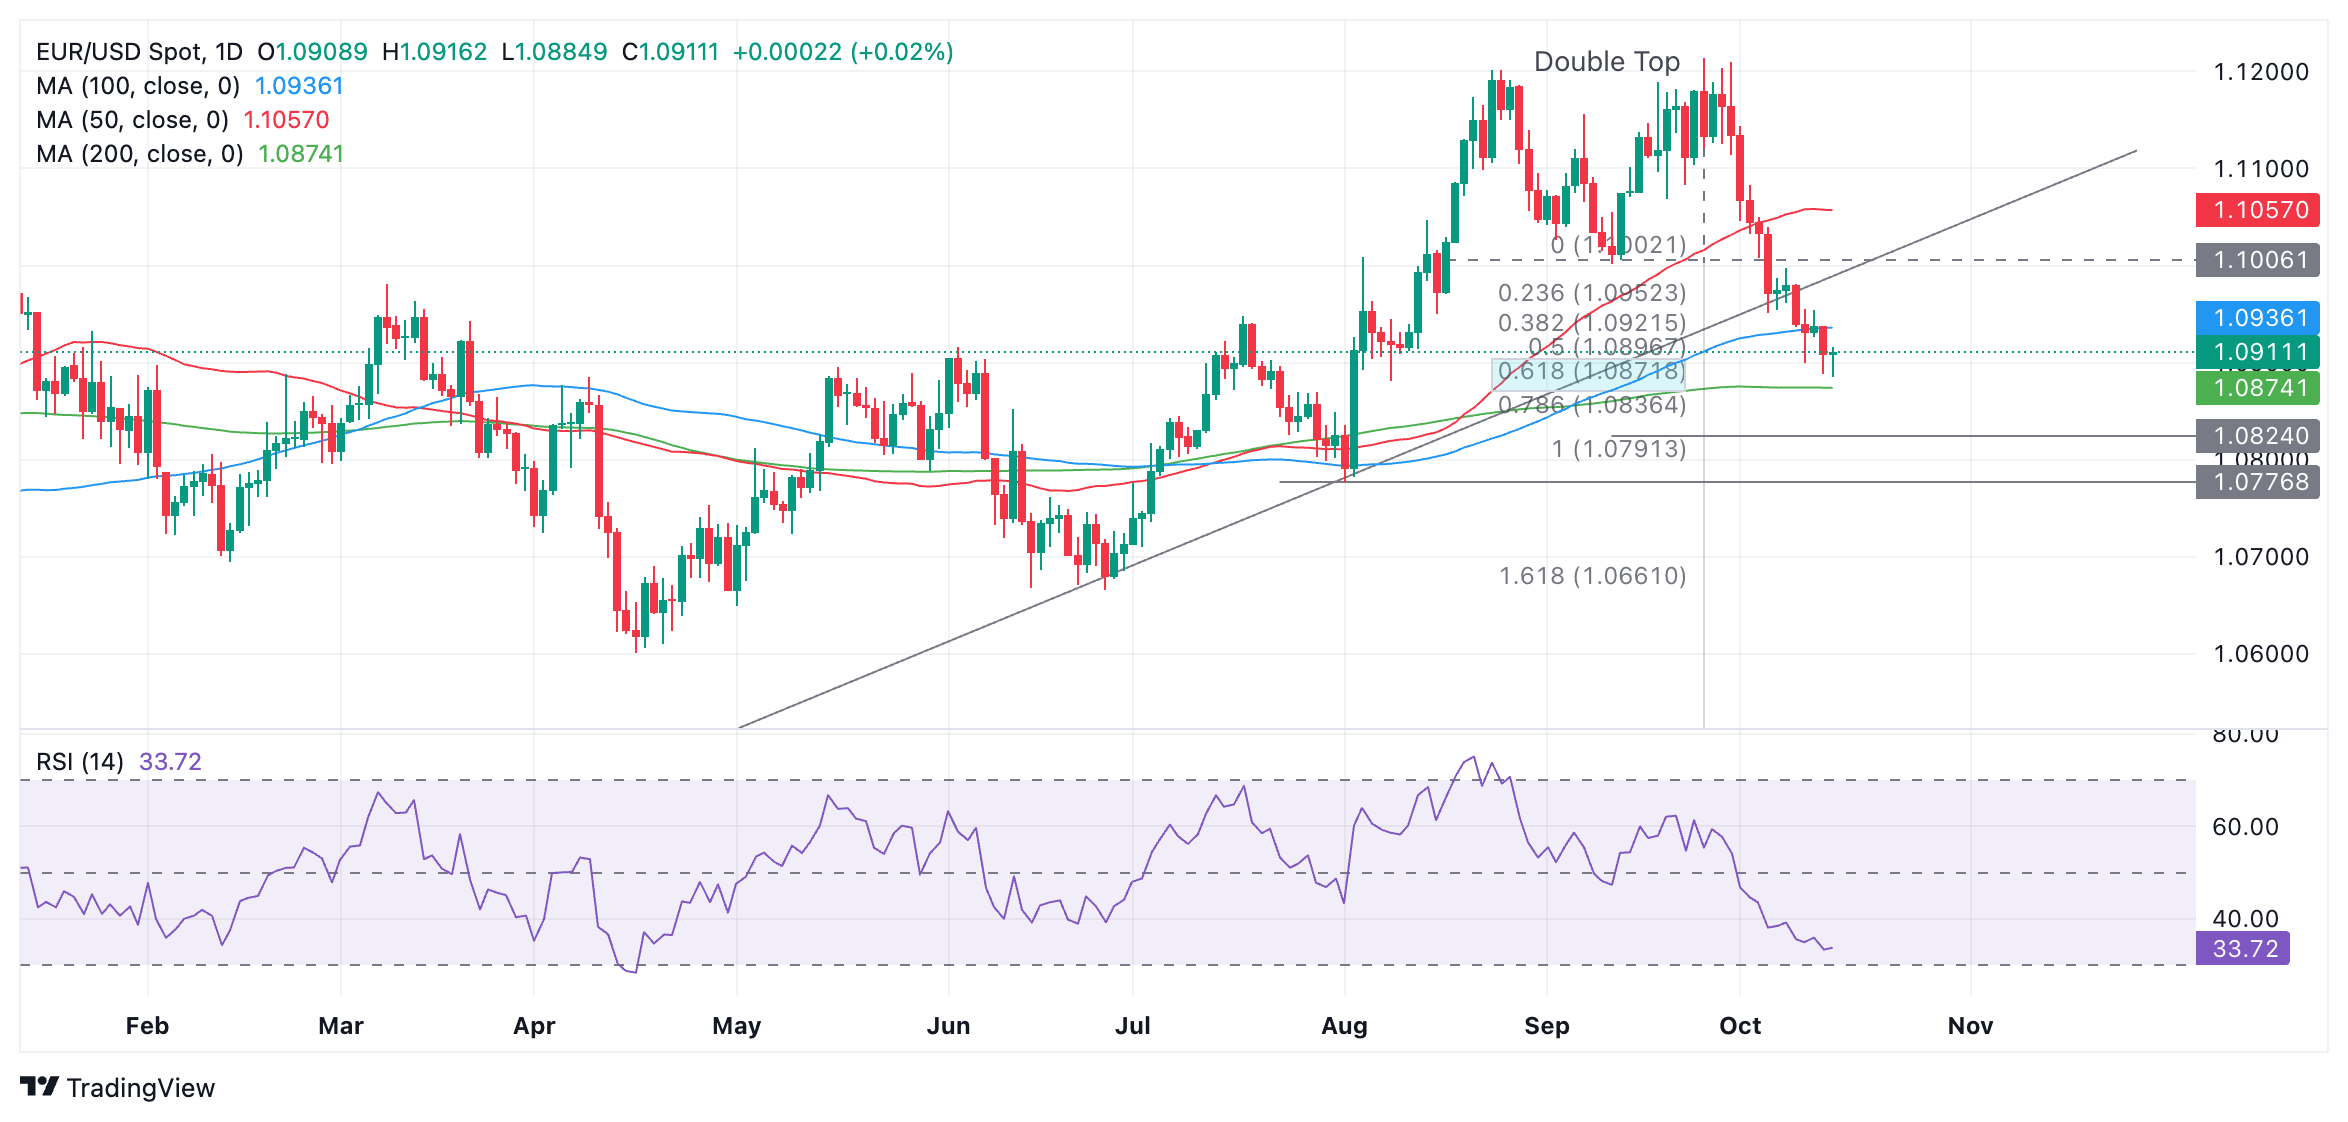
EUR/USD probably formed a Double Top reversal pattern in August and September. The first downside target for the pattern lies at 1.0872 which has almost been met at the low of the day (1.0885). This equates with the 61.8% Fibonacci extension of the height of the Double Top extrapolated lower (blue shaded rectangle on the chart).
A further target lies at 1.0874, at the (green) 200-day SMA. Another more bearish target lies at 1.0824, generated by the trendline break.
The fact the initial target at 1.0872 has almost been met could mean that bearish momentum will ease off. However, momentum is not oversold yet and a break below 1.0860 would probably suggest more downside towards the target at 1.0824.
Momentum, as measured by the Relative Strength Index (RSI), is mirroring price as it tracks lower, which is a mildly bearish sign.