Mulai sekarang, kami Elev8
Kami bukan sekadar broker. Kami adalah ekosistem trading all-in-one—semua yang Anda butuhkan untuk menganalisis, trading, dan berkembang ada di satu tempat. Siap untuk meningkatkan trading Anda?
Kami bukan sekadar broker. Kami adalah ekosistem trading all-in-one—semua yang Anda butuhkan untuk menganalisis, trading, dan berkembang ada di satu tempat. Siap untuk meningkatkan trading Anda?
The US Dollar (USD) holds its footing on Thursday after a weak start to the day, as investors digest fresh tariff threats from US President Donald Trump.
The Greenback slipped during Asian trading hours and retraced some of this week’s gains. It also came under pressure from a sharp drop in Treasury yields, driven by strong demand in Wednesday’s 10-year note auction and signals in the June Federal Open Market Committee (FOMC) Meeting Minutes that interest rates could be lowered later this year.
The US Dollar Index (DXY), which measures the value of the Greenback against a basket of six major currencies, is edging higher during European trading hours. At the time of writing, the index hovers around 97.57, recovering from a daily low of 97.27.
President Trump escalated his trade offensive on Wednesday by releasing a second round of tariff letters on his Truth Social platform. The new letters targeted seven additional countries — including the Philippines, Brunei, Moldova, Algeria, Iraq, Libya, and Sri Lanka — with proposed import tariffs ranging from 20% to 30%. The move adds to the growing list of nations facing potential US trade action and has heightened investor concerns over a broader global trade conflict, lending some support to the US Dollar.
He also issued a stern letter targeting Brazil, with a 50% tariff on its exports, citing the "witch hunt" trial of former Brazilian President Jair Bolsonaro, a right-wing ally of Trump. He wrote a letter to Brazilian President Luiz Inacio Lula da Silva, calling the trial an "international disgrace" and demanding it end "IMMEDIATELY!". While analysts consider this move politically charged, it highlights Trump’s hardline trade stance.
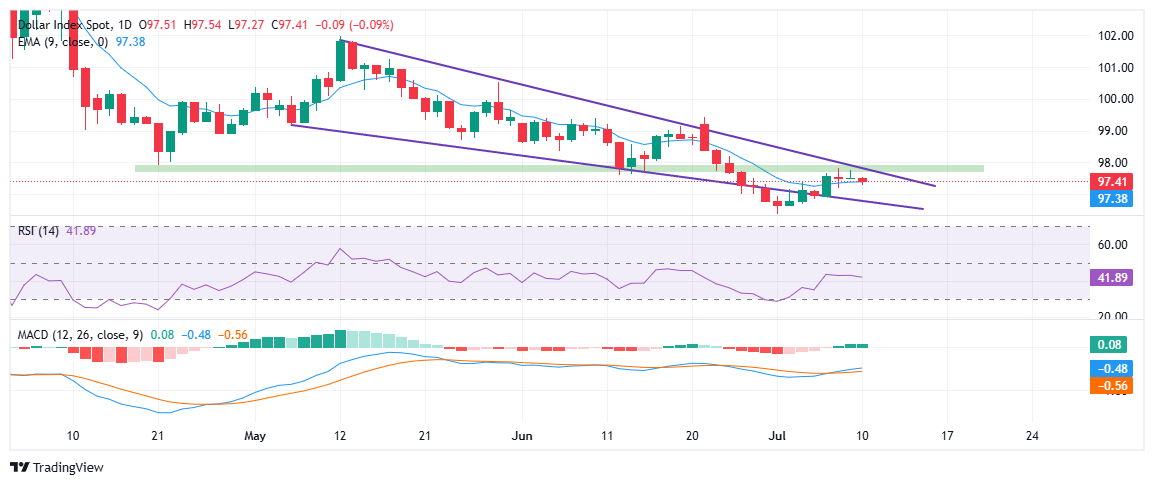
The US Dollar Index (DXY) is hovering near 97.40 on Thursday, consolidating after a bounce from a three-year low of 97.27 earlier this month. The index continues to move within a well-defined falling wedge pattern, a structure often associated with bullish reversal potential.
The 97.80-98.00 zone, which previously acted as support, has now turned into resistance and aligns closely with the upper boundary of the wedge, creating a critical barrier for any upside breakout, while the 9-day EMA at 97.38 acts as a short-term dynamic support zone.
Momentum indicators show tentative recovery but lack strong conviction. The Relative Strength Index (RSI) is hovering around 41.89, recovering from oversold territory but still below the neutral 50 line. Meanwhile, the MACD is showing early signs of a bullish crossover, with the histogram turning slightly positive.
A breakout above 98.00 would signal a potential trend reversal, while sustained weakness below 97.50 could trigger a retest of the lower boundary of the falling wedge pattern near 96.50.
The table below shows the percentage change of US Dollar (USD) against listed major currencies today. US Dollar was the strongest against the Swiss Franc.
| USD | EUR | GBP | JPY | CAD | AUD | NZD | CHF | |
|---|---|---|---|---|---|---|---|---|
| USD | 0.10% | 0.08% | -0.01% | -0.00% | -0.27% | -0.19% | 0.19% | |
| EUR | -0.10% | -0.03% | -0.10% | -0.08% | -0.34% | -0.29% | 0.07% | |
| GBP | -0.08% | 0.03% | -0.12% | -0.05% | -0.31% | -0.24% | 0.10% | |
| JPY | 0.01% | 0.10% | 0.12% | 0.02% | -0.24% | -0.10% | 0.10% | |
| CAD | 0.00% | 0.08% | 0.05% | -0.02% | -0.23% | -0.21% | 0.15% | |
| AUD | 0.27% | 0.34% | 0.31% | 0.24% | 0.23% | 0.02% | 0.45% | |
| NZD | 0.19% | 0.29% | 0.24% | 0.10% | 0.21% | -0.02% | 0.36% | |
| CHF | -0.19% | -0.07% | -0.10% | -0.10% | -0.15% | -0.45% | -0.36% |
The heat map shows percentage changes of major currencies against each other. The base currency is picked from the left column, while the quote currency is picked from the top row. For example, if you pick the US Dollar from the left column and move along the horizontal line to the Japanese Yen, the percentage change displayed in the box will represent USD (base)/JPY (quote).