এখন থেকে আমরা Elev8
আমরা শুধুমাত্র একটি ব্রোকার নই। আমরা একটি সর্বাত্মক ট্রেডিং ইকোসিস্টেম—বিশ্লেষণ, ট্রেড, এবং প্রবৃদ্ধির জন্য আপনার যা কিছু প্রয়োজন তা এক জায়গায়। আপনার ট্রেডিং উন্নত করতে প্রস্তুত?
আমরা শুধুমাত্র একটি ব্রোকার নই। আমরা একটি সর্বাত্মক ট্রেডিং ইকোসিস্টেম—বিশ্লেষণ, ট্রেড, এবং প্রবৃদ্ধির জন্য আপনার যা কিছু প্রয়োজন তা এক জায়গায়। আপনার ট্রেডিং উন্নত করতে প্রস্তুত?
WTI trades near $58.10 during Thursday’s Asian session. The black gold recently took a U-turn from 200-day SMA and an ascending trend line since early October. However, 50-day SMA holds the key to the pair’s further upside.
As a result, buyers will look for entry beyond $59.00 while aiming for 38.2% Fibonacci retracement of the October-January rise, at $60.15.
Should WTI oil prices stay positive beyond $60.15, the 23.6% of Fibonacci retracement, near $62.25, becomes important to watch.
Meanwhile, the bears will look for entry below a 200-day SMA level of $57.75. In doing so, 61.8% of Fibonacci retracement, at $56.70, will be their next target.
In a case where the quote remains weak under $56.70, November 29 low near $55 will be on the seller’s radar.
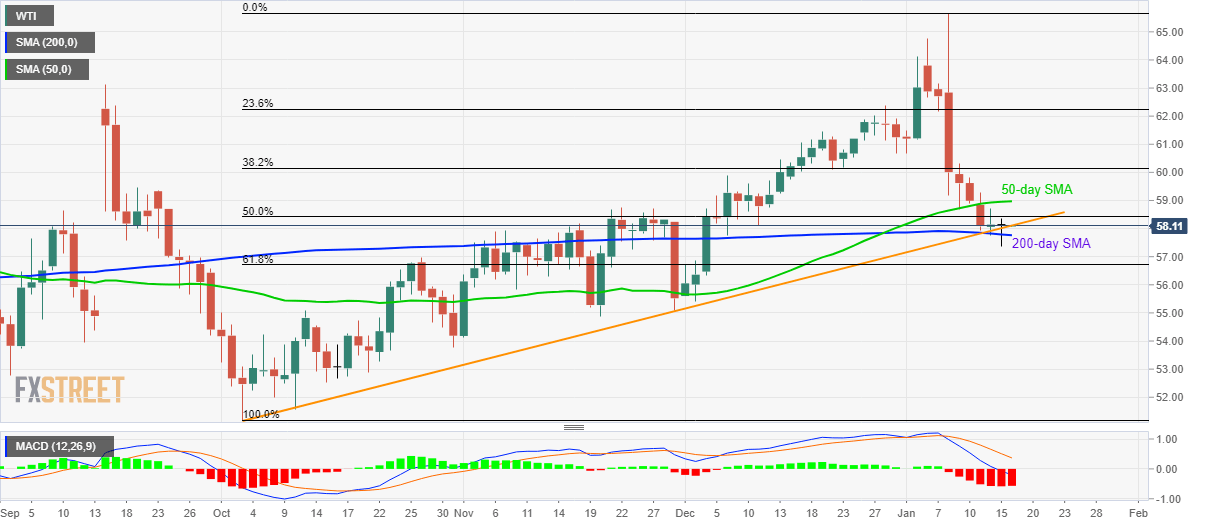
Trend: Pullback expected