اب سے ہم Elev8 ہیں
ہم صرف ایک بروکر نہیں ہیں۔ ہم ایک جامع ٹریڈنگ ایکوسسٹم ہیں—ہر چیز جو آپ کو تجزیے، ٹریڈ اور ترقی کے لیے درکار ہو، ایک ہی جگہ پر ہے۔ کیا آپ اپنی ٹریڈنگ کو بلند کرنے کے لیے تیار ہیں؟
ہم صرف ایک بروکر نہیں ہیں۔ ہم ایک جامع ٹریڈنگ ایکوسسٹم ہیں—ہر چیز جو آپ کو تجزیے، ٹریڈ اور ترقی کے لیے درکار ہو، ایک ہی جگہ پر ہے۔ کیا آپ اپنی ٹریڈنگ کو بلند کرنے کے لیے تیار ہیں؟
USD/IDR stays above the medium-term trend line supports while trading around 13,650 ahead of the European session on Monday. The pair has been struggling to extend its downpour below multi-month-old support-lines since December 13 wherein oversold conditions of RSI favor a pullback before further declines.
With this, a 10-day SMA level near 13,740 can please buyers during the recovery. However, the pair’s additional upside will be challenged by December 31 low near 13,835 and 14,000 round-figure.
Should prices manage to remain strong beyond 14,000, monthly top surrounding 14,025 and 200-day SMA level of 14,143 will be the key to watch.
In a case prices manage to register a daily closing below 13,630, mid-February 2018 low surrounding 13,500 cold lure the bears.
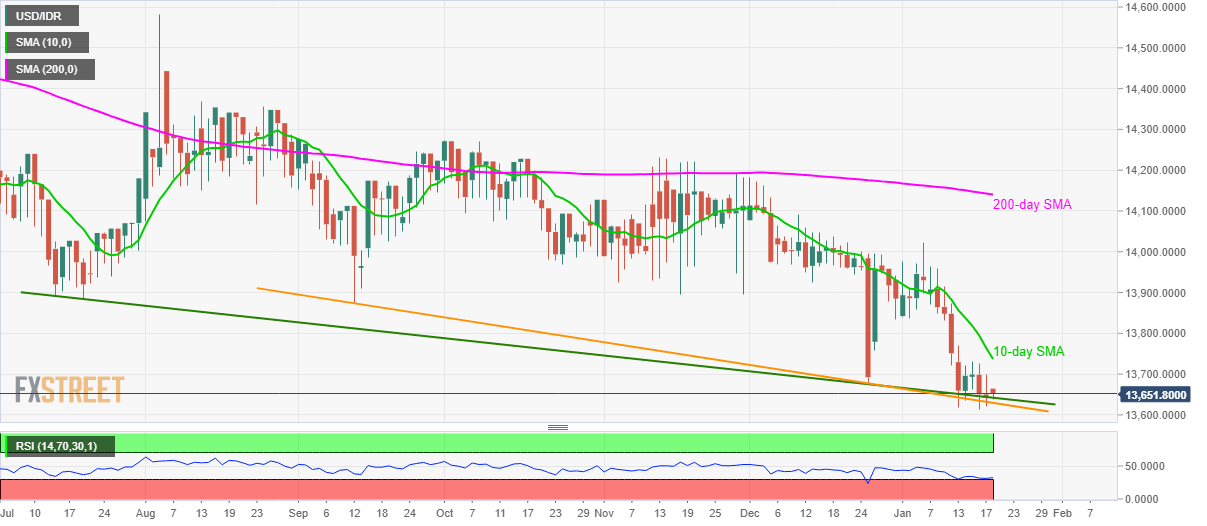
Trend: Pullback expected