Kể từ bây giờ chúng tôi là Elev8
Chúng tôi không chỉ là một nhà môi giới. Chúng tôi là một hệ sinh thái giao dịch tất cả trong một—mọi thứ bạn cần để phân tích, giao dịch và phát triển đều có ở một nơi. Sẵn sàng nâng tầm giao dịch của bạn?
Chúng tôi không chỉ là một nhà môi giới. Chúng tôi là một hệ sinh thái giao dịch tất cả trong một—mọi thứ bạn cần để phân tích, giao dịch và phát triển đều có ở một nơi. Sẵn sàng nâng tầm giao dịch của bạn?
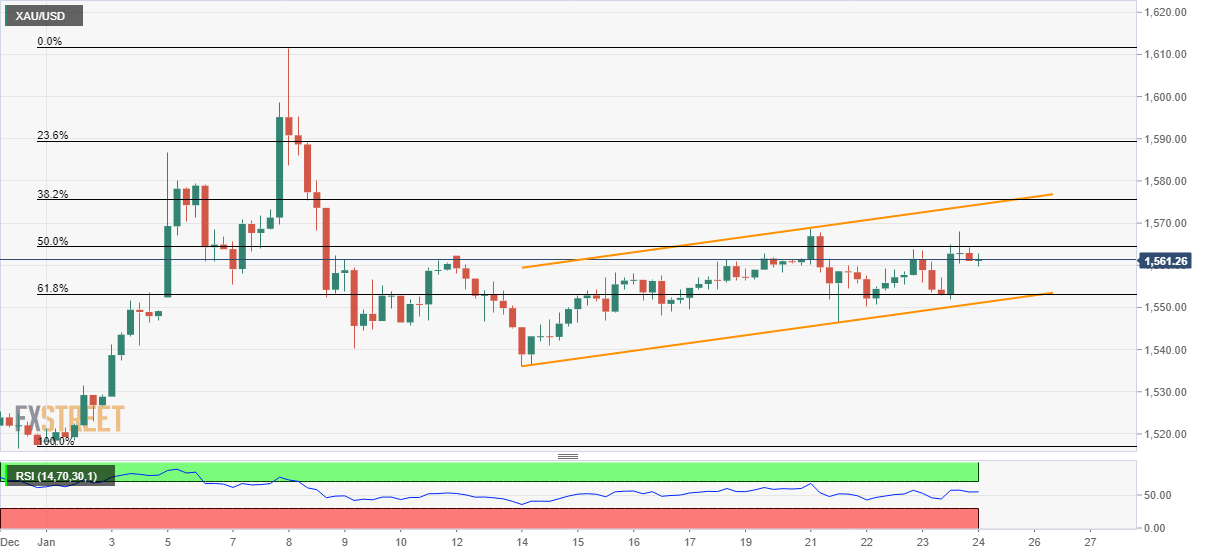
Gold prices lack momentum while trading around $1,561.50 during early Friday. Even so, the bullion stays inside a short-term ascending trend-channel formation that portrays the strength of the underlying momentum.
With this, buyers can take aim at the formation resistance surrounding $1,574.50 if managed to break 50% Fibonacci retracement of the early-month upside, at $1,564.50.
In a case where the bulls dominate past-$1,575, 23.6% Fibonacci retracement level of $1,590 can offer an intermediate halt during the run-up to $1,600 and then to the monthly high near $1,612.
On the downside, 61.8% Fibonacci retracement and the channel’s support line will question the sellers close to $1,553 and $1,551. Also nearing will be $1,550 round-figure.
Given the bears’ ability to rule below $1,550, the current month’s low of $1,536 and $1,530 could flash on their radars while $1,517 could grab the spotlight afterward.
Trend: Further recovery expected