اب سے ہم Elev8 ہیں
ہم صرف ایک بروکر نہیں ہیں۔ ہم ایک جامع ٹریڈنگ ایکوسسٹم ہیں—ہر چیز جو آپ کو تجزیے، ٹریڈ اور ترقی کے لیے درکار ہو، ایک ہی جگہ پر ہے۔ کیا آپ اپنی ٹریڈنگ کو بلند کرنے کے لیے تیار ہیں؟
ہم صرف ایک بروکر نہیں ہیں۔ ہم ایک جامع ٹریڈنگ ایکوسسٹم ہیں—ہر چیز جو آپ کو تجزیے، ٹریڈ اور ترقی کے لیے درکار ہو، ایک ہی جگہ پر ہے۔ کیا آپ اپنی ٹریڈنگ کو بلند کرنے کے لیے تیار ہیں؟
WTI stays on the back foot while flashing $53.15 as a quote during Thursday’s Asian session. The energy benchmark fails to cross late-Friday tops during its latest bounce. In doing so, it justifies the near-term bearish formation.
That said, oil prices are now declining towards the weekly low of $52.17 while the channel’s support line near $50.70 can lure the bears afterward.
Though, multiple lows marked since late-January 2019 around $50.60 and $50.00 round-figure could keep the sellers checked below $50.70.
Meanwhile, an immediate horizontal resistance line near $54.40 and the bearish pattern’s upper line, at $54.65, could keep the energy benchmark’s near-term recovery capped.
If at all buyers manage to conquer $54.65, 200-bar SMA level near $59.30 will keep them away from $60.00 resistance.
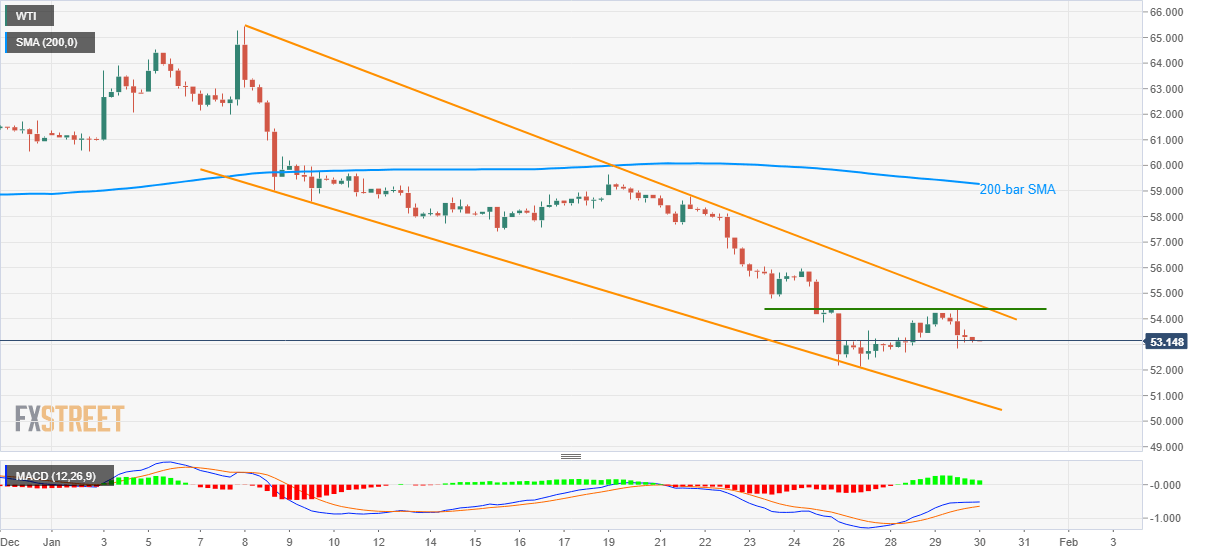
Trend: Bearish