Kể từ bây giờ chúng tôi là Elev8
Chúng tôi không chỉ là một nhà môi giới. Chúng tôi là một hệ sinh thái giao dịch tất cả trong một—mọi thứ bạn cần để phân tích, giao dịch và phát triển đều có ở một nơi. Sẵn sàng nâng tầm giao dịch của bạn?
Chúng tôi không chỉ là một nhà môi giới. Chúng tôi là một hệ sinh thái giao dịch tất cả trong một—mọi thứ bạn cần để phân tích, giao dịch và phát triển đều có ở một nơi. Sẵn sàng nâng tầm giao dịch của bạn?
Gold prices decline to $1,580 ahead of the European session on Monday. The bullion initially surged to the highest since January 08 but couldn’t rise farther than $1,594 and witnessed a pullback. Even so, the bullion stays above the short-term support line and 50-bar SMA.
As a result, buyers will stay hopeful while targeting $1,590 and a one-week-old rising trend line, at $1,595 now, a break of which could propel the yellow metal towards $1,600 round-figure.
In a case where the bulls manage to dominate past-$1,600, the precious metal’s run-up to the yearly top surrounding $1,612 can’t be ruled out.
On the downside break below $1,573.30/72.80 confluence, a bearish chart pattern gets confirmed.
With that, sellers could aim for a late-January low near $1,564 prior to targeting the yearly low near $1,517.
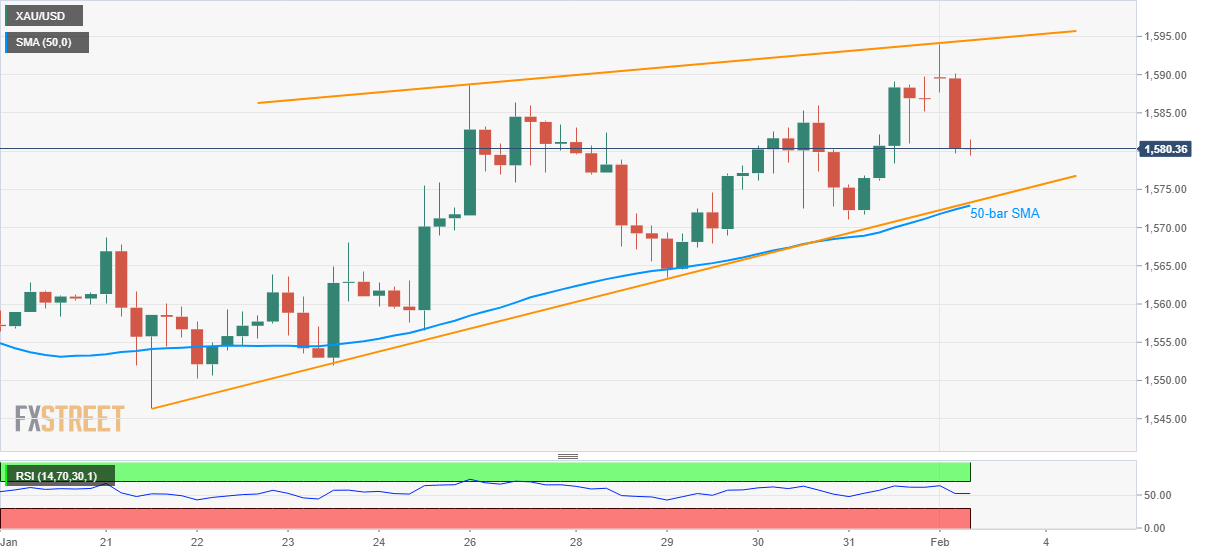
Trend: Bullish