Kể từ bây giờ chúng tôi là Elev8
Chúng tôi không chỉ là một nhà môi giới. Chúng tôi là một hệ sinh thái giao dịch tất cả trong một—mọi thứ bạn cần để phân tích, giao dịch và phát triển đều có ở một nơi. Sẵn sàng nâng tầm giao dịch của bạn?
Chúng tôi không chỉ là một nhà môi giới. Chúng tôi là một hệ sinh thái giao dịch tất cả trong một—mọi thứ bạn cần để phân tích, giao dịch và phát triển đều có ở một nơi. Sẵn sàng nâng tầm giao dịch của bạn?
WTI keeps losses, despite bouncing off the recently flashed 13-month low of $49.77, while taking rounds to $50.00 during Tuesday’s Asian session. Given the black gold’s sustained break below 23.6% Fibonacci retracement of its big fall in the year 2018, coupled with bearish MACD signals, oil prices are likely to remain weak.
That said, early-January 2019 top nearing $49.40 and the late 2018 highs around $47.00 will be on the bears' radar during the energy benchmark’s further declines.
However, the year 2018 bottom close to 42.50/45 will give chances to buyers for entry.
Meanwhile, a 23.6% Fibonacci retracement level of $50.60 offers immediate resistance ahead of $53.00 and $53.80 upside barriers.
Additionally, buyers will have to re-think on their bullish outlook unless WTI prices break November month low near $54.85.
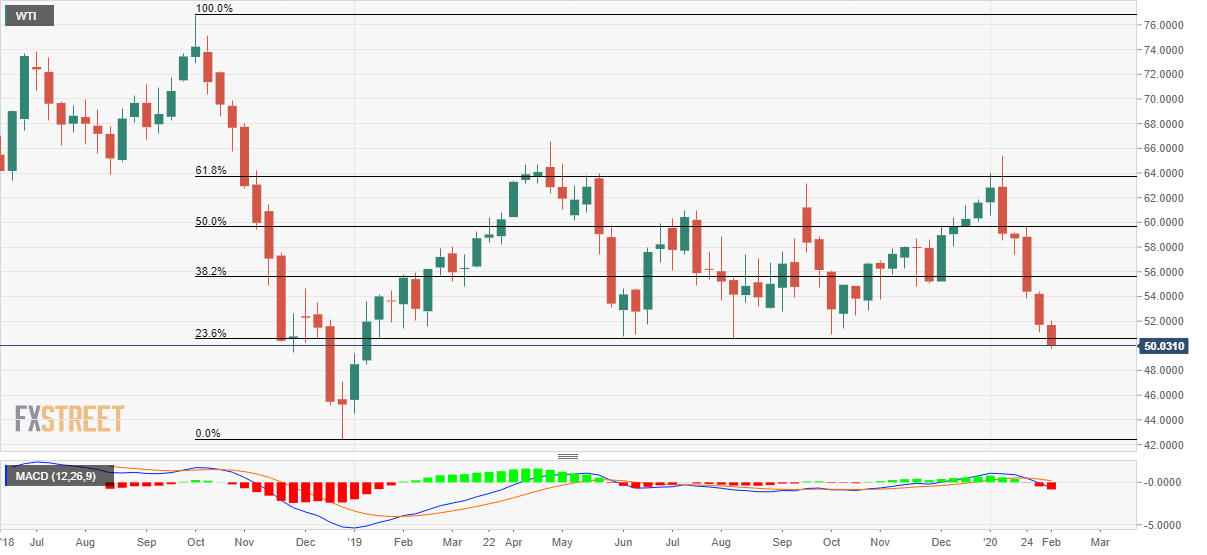
Trend: Bearish