Kể từ bây giờ chúng tôi là Elev8
Chúng tôi không chỉ là một nhà môi giới. Chúng tôi là một hệ sinh thái giao dịch tất cả trong một—mọi thứ bạn cần để phân tích, giao dịch và phát triển đều có ở một nơi. Sẵn sàng nâng tầm giao dịch của bạn?
Chúng tôi không chỉ là một nhà môi giới. Chúng tôi là một hệ sinh thái giao dịch tất cả trong một—mọi thứ bạn cần để phân tích, giao dịch và phát triển đều có ở một nơi. Sẵn sàng nâng tầm giao dịch của bạn?
WTI rises to $52.40 during Wednesday’s Asian session. Even so, the black gold stays below 21-day SMA while a bearish candlestick formation keeps the sellers hopeful.
That said, $51.00 can act as immediate support during the pullback whereas the monthly bottom surrounding $49.40 could gain market attention afterward.
If at all oil prices slip below $49.40, late-October 2017 low near $49.00 might return to the chart.
Meanwhile, the oil benchmark’s ability to cross the 21-day EMA level of $52.91 defies the bearish candlestick formation.
In doing so, January 29 high of $54.37 and January 15 low nearing $57.40 can flash on the bull’s radar.
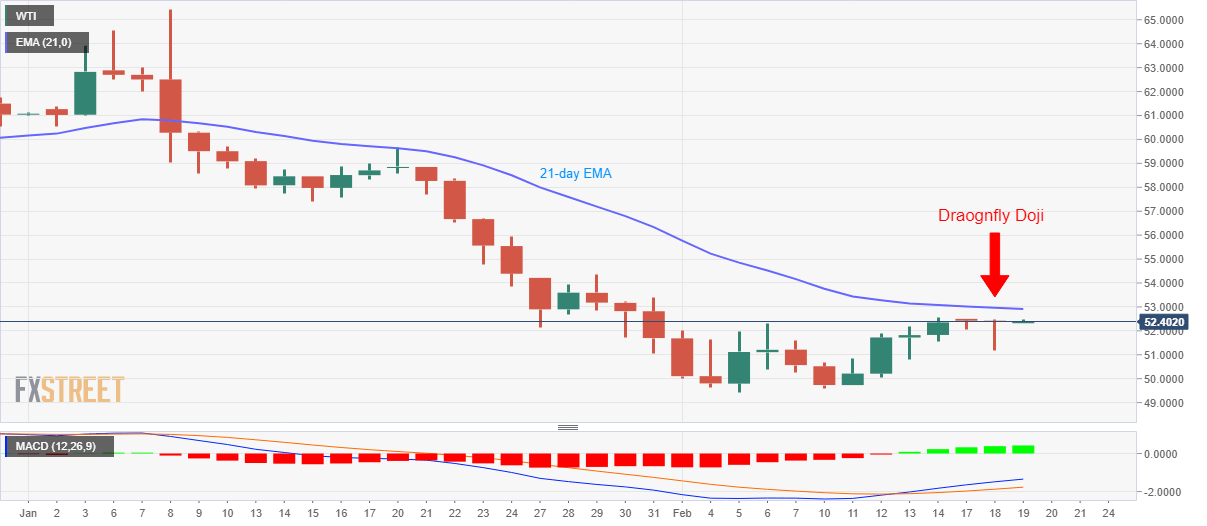
Trend: Bearish