Kể từ bây giờ chúng tôi là Elev8
Chúng tôi không chỉ là một nhà môi giới. Chúng tôi là một hệ sinh thái giao dịch tất cả trong một—mọi thứ bạn cần để phân tích, giao dịch và phát triển đều có ở một nơi. Sẵn sàng nâng tầm giao dịch của bạn?
Chúng tôi không chỉ là một nhà môi giới. Chúng tôi là một hệ sinh thái giao dịch tất cả trong một—mọi thứ bạn cần để phân tích, giao dịch và phát triển đều có ở một nơi. Sẵn sàng nâng tầm giao dịch của bạn?
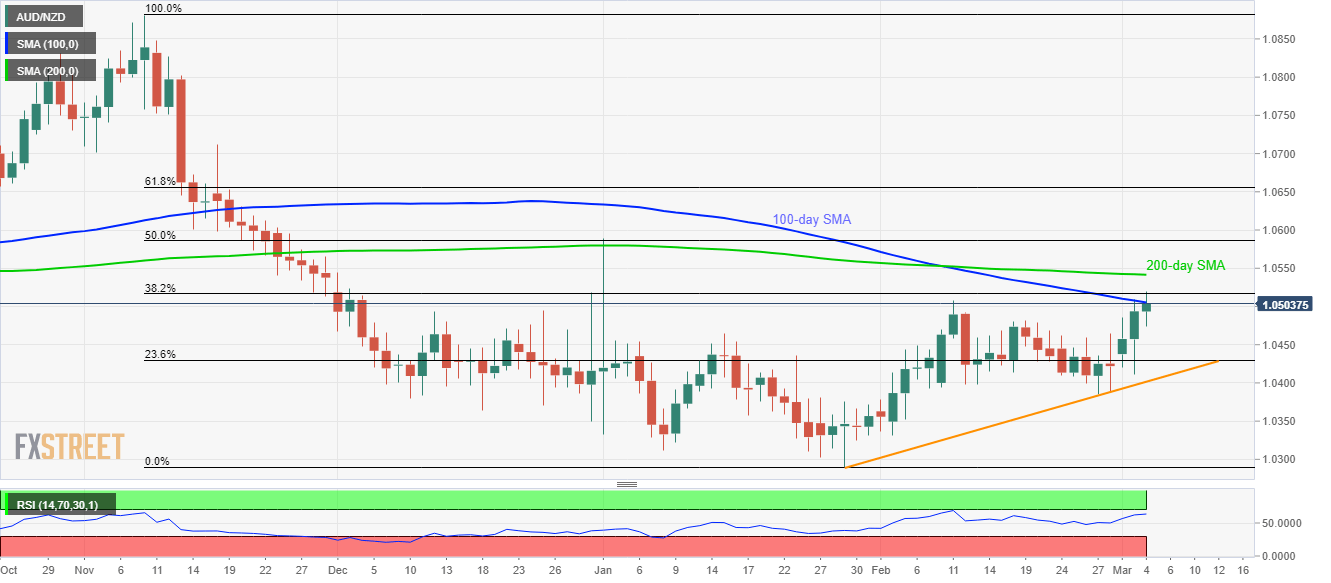
AUD/NZD registers 0.13% gains to 1.0506 by the press time of Wednesday’s Asian session. The pair recently surged crossed 100-day SMA after Australia’s fourth quarter (Q4) GDP data beat expectations to the upside.
Read: Breaking: Australia Q4 GDP beats estimates and supports AUD higher
Even so, the pair’s further buying may wait for a sustained break of 38.2% Fibonacci retracement of its November 2019 to January 2020 fall, at 1.0517.
Following that, the 200-day SMA level near 1.0540 becomes the key upside barrier holding gates for 1.0600 and 61.8% Fibonacci retracement level near 1.0660.
On the downside, 1.0460 and 23.6% Fibonacci retracement near 1.0430 act as near-term key supports ahead of an upward sloping trend line since January 29, 2020, currently around 1.0400.
In a case where the pair drops below 1.0400, 1.0300 and the yearly low near 1.0290 are likely to return to the charts.
Trend: Bullish