Kể từ bây giờ chúng tôi là Elev8
Chúng tôi không chỉ là một nhà môi giới. Chúng tôi là một hệ sinh thái giao dịch tất cả trong một—mọi thứ bạn cần để phân tích, giao dịch và phát triển đều có ở một nơi. Sẵn sàng nâng tầm giao dịch của bạn?
Chúng tôi không chỉ là một nhà môi giới. Chúng tôi là một hệ sinh thái giao dịch tất cả trong một—mọi thứ bạn cần để phân tích, giao dịch và phát triển đều có ở một nơi. Sẵn sàng nâng tầm giao dịch của bạn?
While following its four-day recovery moves, NZD/USD questions a short-term descending trend line resistance, currently up 0.06% at 0.6298, amid the early Thursday.
With the gradually rising RSI from oversold conditions, the pullback in prices is likely to remain present. As a result, 23.6% Fibonacci retracement of the pair’s declines from December 31, 2019, to February 28, at 0.6323 will grab buyers’ attention.
Given the quote’s successful trading above 0.6323, 21-day SMA around 0.6360 will be the key to watch.
It should, however, be noted that the bears’ aren’t likely to lose hopes unless the pair registers a clear break of 100/200-day SMA confluence around 0.6485.
On the contrary, 0.6240 and 0.6200 can offer intermediate rest ahead of the latest low near 0.6190 during the pair’s declines.
In a case where the bears keep dominating past-0.6190, the year 2018 bottom close to 0.6145 will lure the sellers.
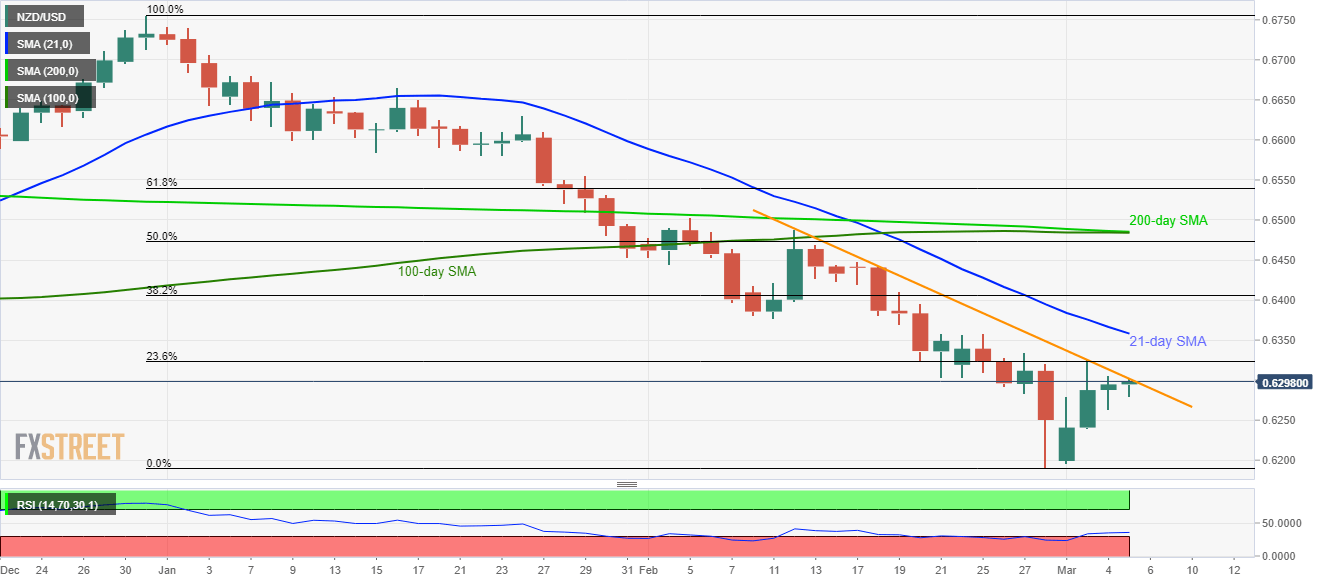
Trend: Further recovery expected