اب سے ہم Elev8 ہیں
ہم صرف ایک بروکر نہیں ہیں۔ ہم ایک جامع ٹریڈنگ ایکوسسٹم ہیں—ہر چیز جو آپ کو تجزیے، ٹریڈ اور ترقی کے لیے درکار ہو، ایک ہی جگہ پر ہے۔ کیا آپ اپنی ٹریڈنگ کو بلند کرنے کے لیے تیار ہیں؟
ہم صرف ایک بروکر نہیں ہیں۔ ہم ایک جامع ٹریڈنگ ایکوسسٹم ہیں—ہر چیز جو آپ کو تجزیے، ٹریڈ اور ترقی کے لیے درکار ہو، ایک ہی جگہ پر ہے۔ کیا آپ اپنی ٹریڈنگ کو بلند کرنے کے لیے تیار ہیں؟
Having dropped decisively below key technical levels, GBP/USD seesaws around 1.2820 amid the Asian session on Thursday.
In addition to 23.6% Fibonacci retracement of the pair’s September-December 2019 upside, at 1.3150, 100-day SMA near 1.3000 also acts as the key upside barrier.
If at all the pair manage to cross 1.3150 on a daily closing basis, tops marked during the early February and late-December 2019, respectively near 1.3200 and 1.3285, can please the bulls.
On the contrary, 50% Fibonacci retracement and 200-day SMA, close to 1.2735 and 1.2710 in that order, can question short-term bears.
Given the bears’ dominance past-1.2710, 61.8% Fibonacci retracement near 1.2550 can return to the charts.
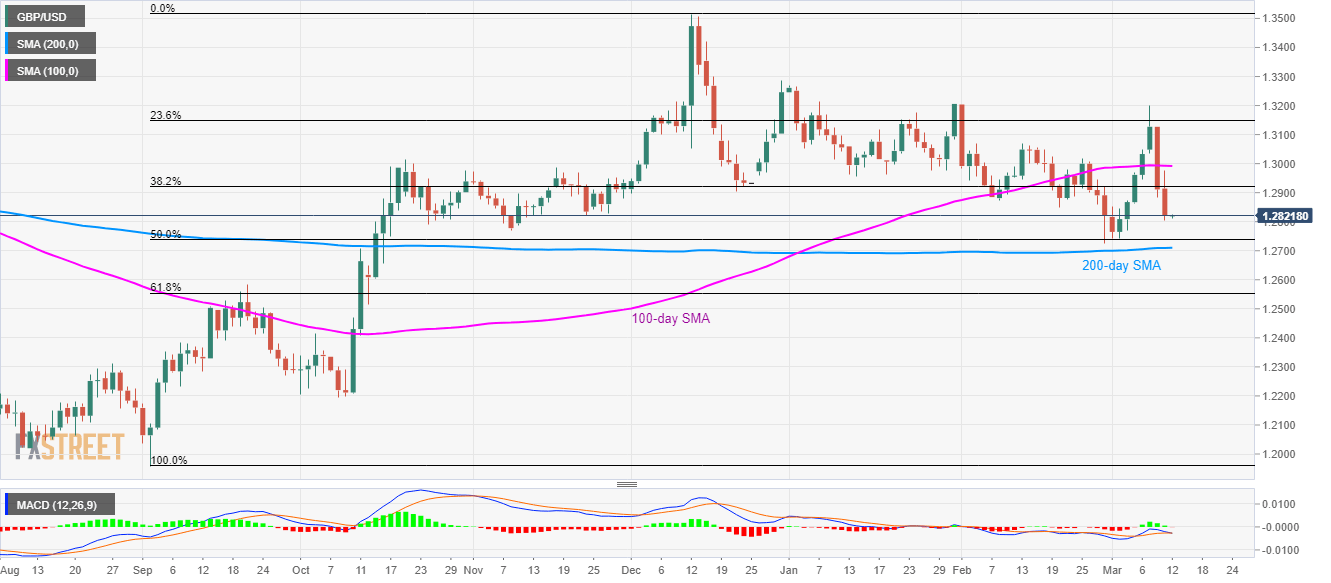
Trend: Bearish