Kể từ bây giờ chúng tôi là Elev8
Chúng tôi không chỉ là một nhà môi giới. Chúng tôi là một hệ sinh thái giao dịch tất cả trong một—mọi thứ bạn cần để phân tích, giao dịch và phát triển đều có ở một nơi. Sẵn sàng nâng tầm giao dịch của bạn?
Chúng tôi không chỉ là một nhà môi giới. Chúng tôi là một hệ sinh thái giao dịch tất cả trong một—mọi thứ bạn cần để phân tích, giao dịch và phát triển đều có ở một nơi. Sẵn sàng nâng tầm giao dịch của bạn?
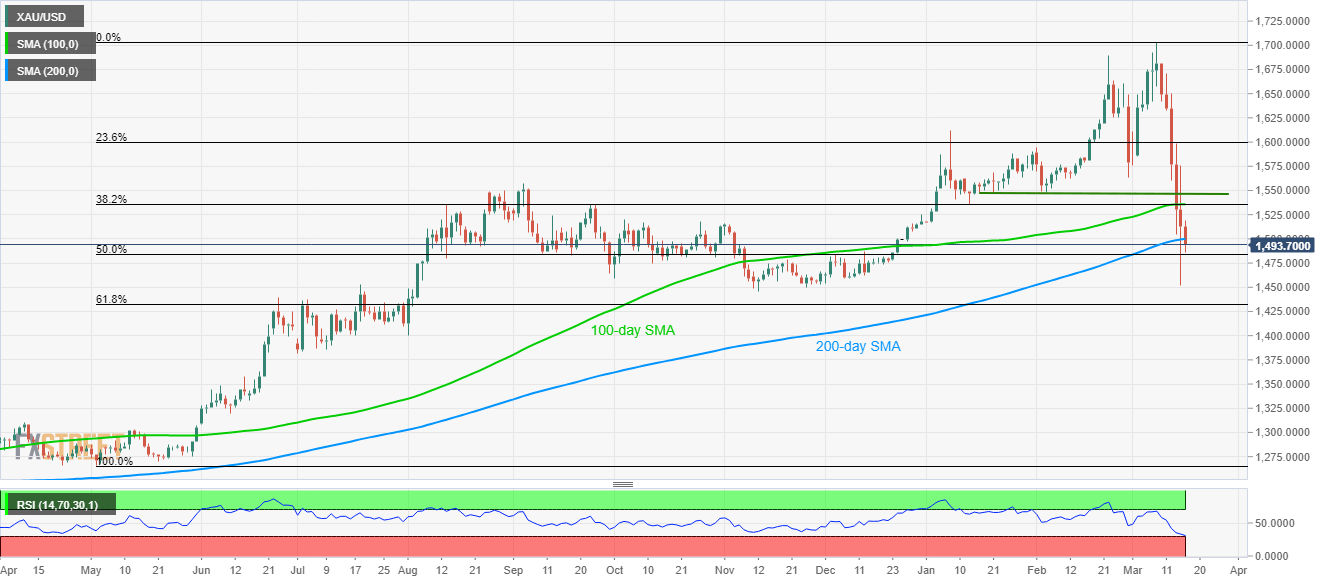
Following the latest pullback from $1,520, Gold prices decline to $1,493, down 1.27%, as the global markets await European traders on Tuesday.
With that, the bullion slips back below 200-day SMA while inching closer to 50% Fibonacci retracement of its run-up from May 2019 to March 2020, at $1,483.
During the quote’s further downside below 50% Fibonacci retracement, November 2019 low surrounding $1,445 and 61.8% of Fibonacci retracement near $1,432 can please the bears.
On the flip side, a confluence of 100-day SMA and 38.2% Fibonacci retracement restricts the yellow metal’s short-term recovery moves near $1,535/36.
Beyond that, lows marked during late-January 2020, also during the February month, around $1,545/46, could question the bulls.
Trend: Further declines likely