From now on we Elev8
We're more than just a broker. We're an all-in-one trading ecosystem—everything you need to analyse, trade, and grow is in one place. Ready to elevate your trading?
We're more than just a broker. We're an all-in-one trading ecosystem—everything you need to analyse, trade, and grow is in one place. Ready to elevate your trading?
NZD/USD takes the bids near 0.5960 during the early Tuesday. In doing so, the pair remains inside a one-week-old descending trend channel while also staying below 50% Fibonacci retracement of the previous month’s upside.
The kiwi pair’s ability to stay beyond 38.2% Fibonacci retracement, amid bullish MACD, seems to favor the buyers, which in turn questions the channel’s resistance, around 0.6000 now.
In a case where the bulls manage to successfully cross 0.6000 mark, a confluence of 200-bar SMA and 61.8% Fibonacci retracement near 0.6080/85 becomes crucial resistance.
On the contrary, the pair’s declines below 38.2% Fibonacci retracement level of 0.5845 needs validation through the channel’s support line, currently at 0.5830.
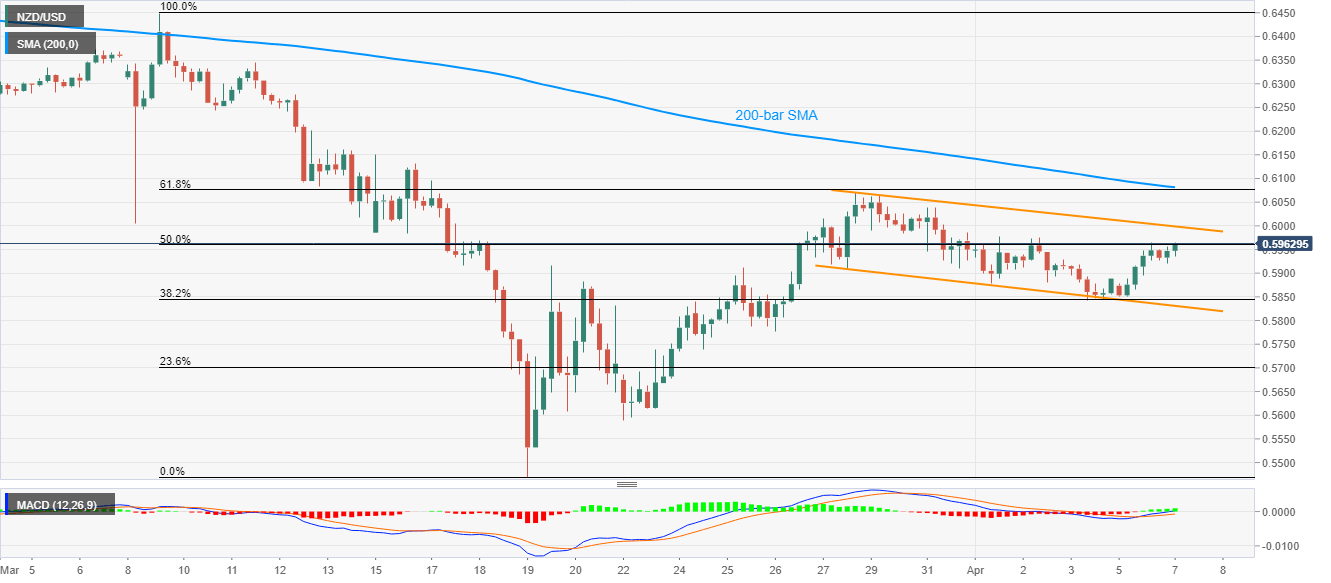
Trend: Further recovery expected